
Korea's floating-debris incident map is a planning aid, not a live hazard tracker
On November 4, 2026, Korea's Ministry of Oceans and Fisheries announced distribution of a map showing where floating-debris entanglement accidents have occurred frequently. Ropes and discarded fishing nets can become caught in a vessel's propeller, leaving the vessel unable to manoeuvre. The ministry reports an annual average of 427 such incidents over the previous five years. That is a national historical count, not the probability of an incident on your particular route tomorrow. A darker area on the map indicates more recorded incidents, not a rope currently detected at that location.
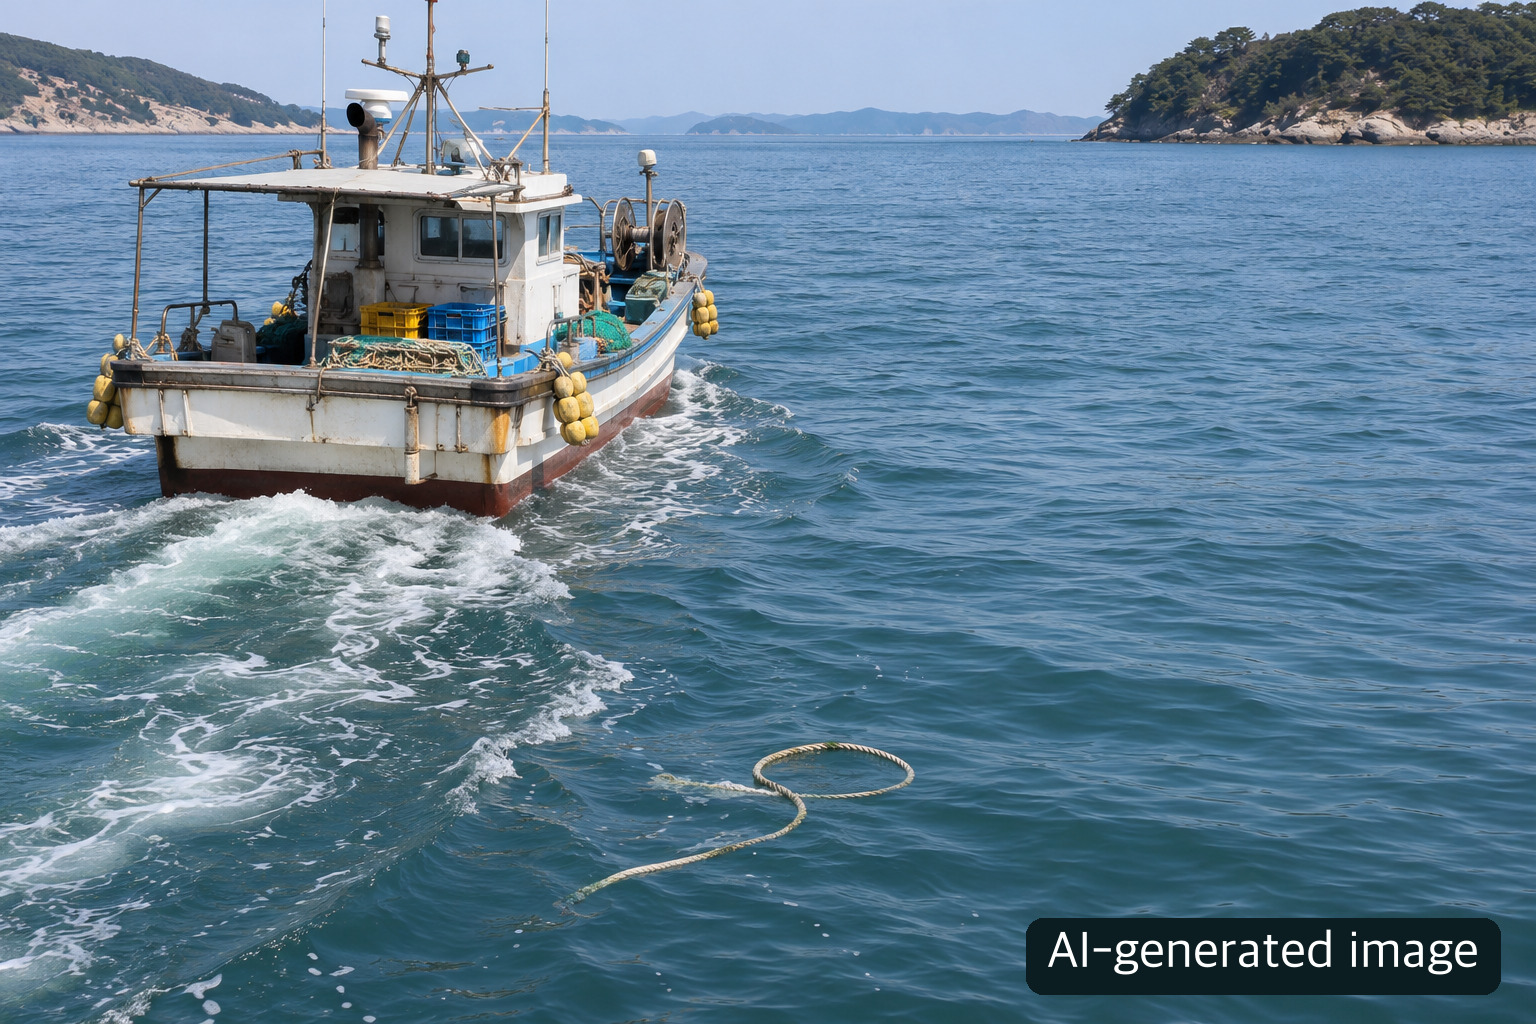
The cover is an AI-generated conceptual scene, not a photograph of a real incident or vessel.
Who is the information for?
The announcement primarily addresses people operating coastal passenger vessels, fishing boats and similar craft. It aims to help them identify past accident concentrations before departure. It does not create a new obligation for every passenger to obtain a printed chart. Passengers should follow their vessel's safety instructions and check notices about weather-related service changes; operational decisions remain with qualified crew.
The consequences of an entanglement can be serious. The ministry explains that a disabled vessel may drift into a grounding or collision, with further danger in bad weather. Yet the historical map cannot certify that a light-coloured area is safe. Recorded frequency, present debris, weather and the vessel's condition are different kinds of information. A route through a dark area is not automatically prohibited, either. Treat the map as one input alongside current maritime warnings and professional judgement.
Six printed regions versus digital coverage
The ministry says it has analysed entanglement incidents in coastal waters nationwide and provided mapped information since 2022. For the six particularly busy regions of Incheon–Pyeongtaek, Daesan–Gunsan, Mokpo–Yeosu, Busan–Yeosu, Ulsan–Donghae and Jeju, it prepares printed maps based on the previous five years of incidents, broken down by season. For 2026, it plans to produce and distribute 2,000 copies through the Korea Maritime Transportation Safety Authority, the Korea Marine Environment Management Corporation and the National Federation of Fisheries Cooperatives' fishing-vessel safety network to relevant coastal operators. This is not an announcement that anyone can immediately request a free copy by post.
The six-region paper edition should not be confused with the broader digital information. The release says high-incidence areas can also appear in the BadaNavi app, on compatible vessel GPS plotters, and through the Maritime Transportation Information System (MTIS) website. The release does not establish that every plotter model has the same interface or that the paper and digital products have identical coverage and update cycles. Check the equipment provider's current instructions before relying on a specific feature. This article deliberately avoids naming unverified buttons or menu paths.
A practical pre-departure check
Start by identifying your intended waters and the season. If you have the relevant printed chart, examine its historical colour coding and note where incidents have clustered. If you use MTIS or an onboard digital service, check the information actually available on your current screen and whether it has been updated. Operators seeking a printed copy should ask their organisation or the named distribution bodies about the current distribution process and availability; the release's 2,000-copy figure is a plan, not proof that copies remain.
Next, separately review the latest weather forecast, navigational warnings, route restrictions, local operations and the vessel's mechanical condition. Historical concentrations can focus attention, but neither a pale area nor the absence of a displayed alert removes the possibility of debris. The map alone cannot guarantee accident prevention. If the map, navigation equipment and conditions disagree, resolve the discrepancy through official safety information and competent operational judgement rather than assuming any one screen is authoritative for all purposes.
The 427 annual average applies to the preceding five years across Korea; it is not a count for each of the six printed regions or for any vessel type. The 2,000 printed copies are the ministry's 2026 production and distribution plan. Distribution timing and access may change, and the ministry's website or the relevant organisation should be checked before departure. The map helps operators ask better questions about their route; it is not a real-time debris detection service or a substitute for the day's safety assessment.
About the Author
The Life Mokcha editorial team reviews official announcements and primary sources to explain practical information. Check the linked original sources for applicable terms and later updates.