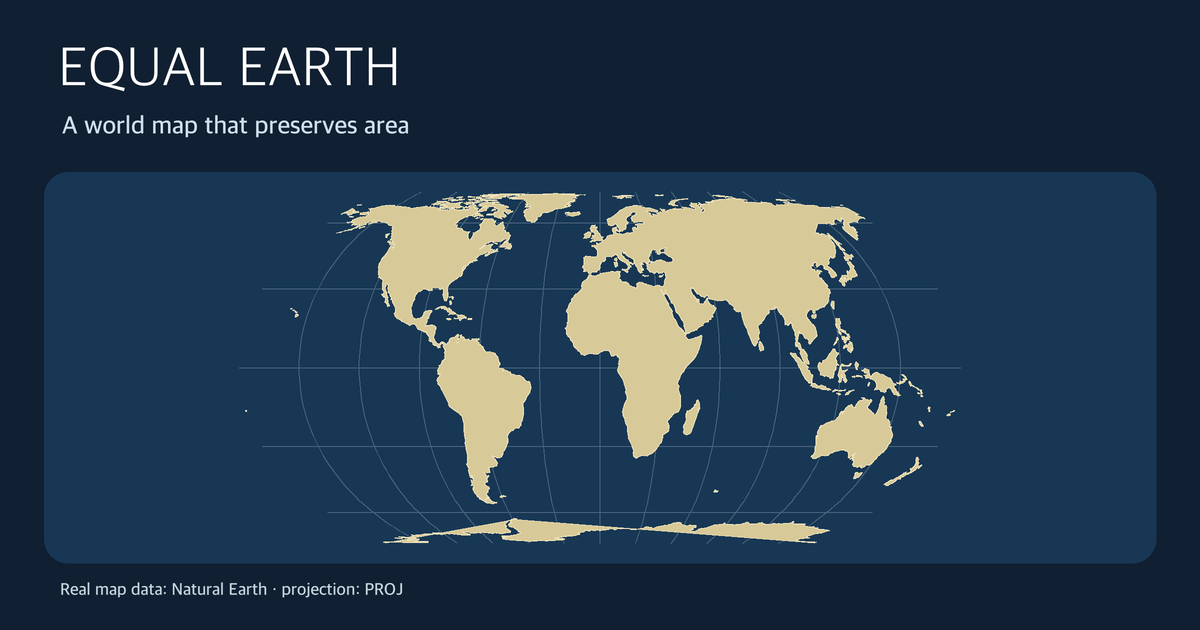
The question “Which world map shows the real sizes of countries?” is best answered by choosing what the map needs to preserve. Comparing regions by area and drawing a constant-bearing course are different tasks. Equal Earth was designed for the former: it is an equal-area projection, not an all-purpose distortion-free image of the globe.
These graphics are not AI-imagined geography. They were rendered from public-domain Natural Earth coastlines using PROJ. The simplified coastline outlines should not be used to measure precise national areas by counting pixels.
The first question: area, angle, or distance?
Flattening a spherical surface cannot preserve area, shape, angle, and every distance at the same time. A useful way to read a world map is to identify what it promises and what it gives up.
- Comparing the relative sizes of regions: choose an equal-area projection such as Equal Earth. Mapped areas retain their real relative proportions.
- Drawing local angles or a constant-bearing navigation course: Mercator's conformal property can help. Its area distortion increases toward the poles, so it is a poor basis for comparing country sizes.
- Estimating distance or the shortest route: do not measure either of these two world maps with a ruler; use a distance calculation or a projection suited to that purpose.
PROJ's Equal Earth documentation says it takes visual inspiration from Robinson while preserving relative areas, unlike Robinson. It credits Bojan Šavrič, Tom Patterson, and Bernhard Jenny with designing it in 2018. “Accurate” here refers specifically to area. It does not promise perfect coastline shapes, local angles, or distances everywhere.
Compare two renderings of the same coastline data
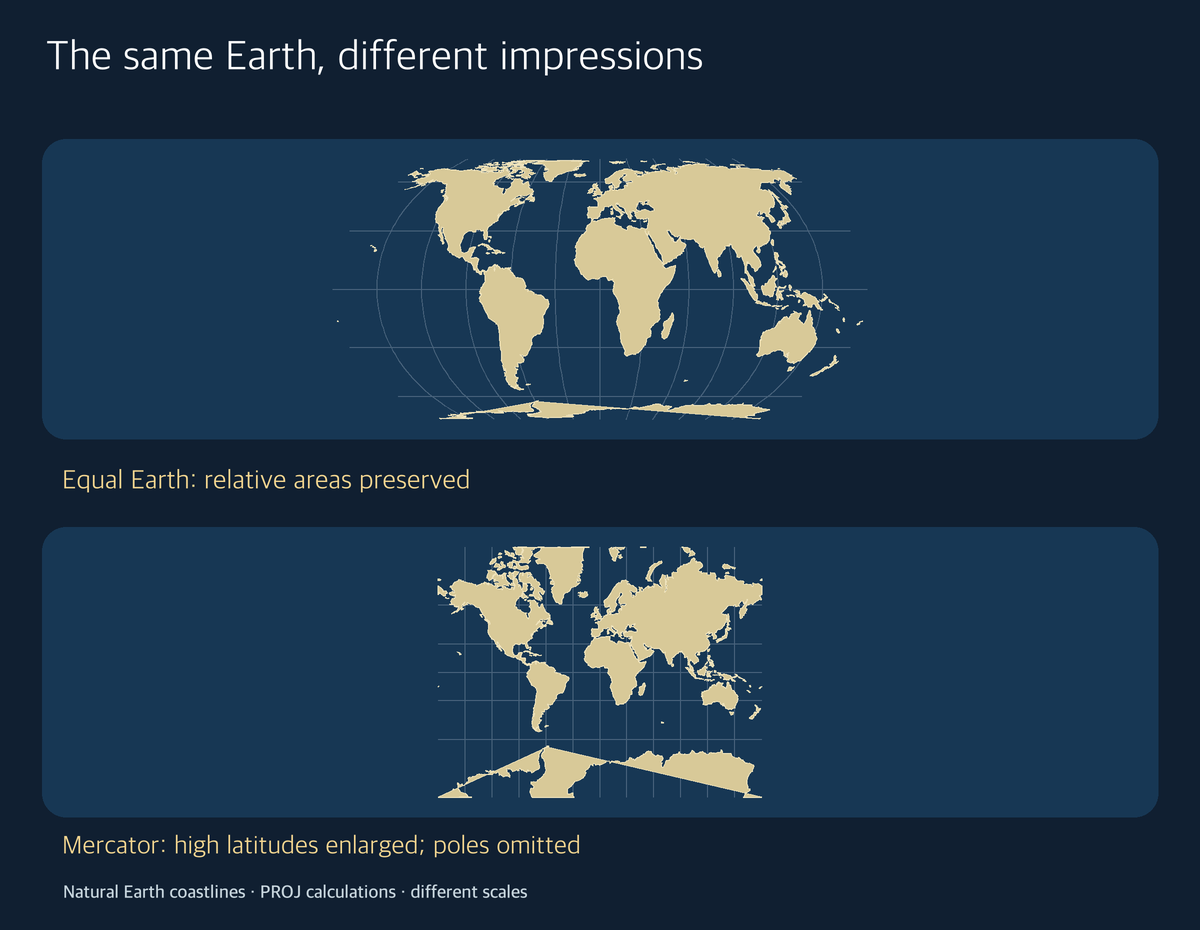
The top panel uses Equal Earth and the bottom uses Mercator, both applied by PROJ to the same Natural Earth coastline dataset. The panels have separate display scales, and the Mercator panel is clipped outside 80 degrees latitude. This is a teaching illustration, not an experiment in which equal-width pixels in the two panels can be compared as a numerical area measure. Look instead at how high-latitude regions change relative to lower-latitude land within the respective maps.
PROJ's Mercator documentation describes a conformal cylindrical projection on which a constant-heading course becomes a straight line. It also calls Mercator unsuitable for a world map intended to show areas because of large area distortions. Rather than declaring one map “true” and the other “false,” ask which property matters to the reader.
A practical map-reading sequence
- State your question. “Which continent has more land?” asks about area; a constant-bearing course asks about direction.
- Check the projection, not just the colour key. On a world choropleth, large-looking high-latitude regions can command disproportionate visual attention on a non-equal-area projection. This is a reading caution, not an official rule.
- Check the map's crop and central meridian. Removing polar regions or shifting the centre changes the visible composition, as in our cropped Mercator illustration.
- Use data for actual figures. A map communicates geography; a precise area comparison needs tabulated measurements and clearly defined geographic boundaries, not pixel-counting of a simplified display.
For a shorter Korean explanation of the name and the main contrast, see the Life Mokcha Naver post.
About the Author
Life Mokcha editor “Mokchajigi” translates official projection documentation into practical map-reading questions. This selection sequence is editorial guidance, not an official cartographic standard for every application.